Where does all the effort go? Looking at Python core developer activity
One of the tasks given me by the Python Software Foundation as part of the Developer in Residence job was to look at the state of CPython as an active software development project. What are people working on? Which standard libraries require most work? Who are the active experts behind which libraries? Those were just some of the questions asked by the Foundation. In this post I’m looking into our Git repository history and our Github PR data to find answers.
All statistics below are based on public data gathered from the python/cpython Git repository and its pull requests. To make the data easy to analyze, they were converted into Python objects with a bunch of scripts that are also open source. The data is stored as a shelf which is a persistent dictionary-like object. I used that since it was the simplest possible thing I could do and very flexible. It was easy to control consistency that way, which was important for doing incremental updates: the project we’re analyzing changes every hour!
Downloading Github PR data from scratch using its REST API is a time consuming process due to the rate limits it imposes of clients. It will take you multiple hours to do it. Fortunately, since this is based on the immutable history of the Git repository and historical pull requests, you can speed things up significantly if you download an existing shelve.db file and start from there.
Before we begin
The work here is based on a snapshot of data in time, it deliberately merges some information, skips over other information, and might otherwise be incomplete or inaccurate due to it essentially being preliminary work. Please avoid drawing far reaching conclusions from this post alone.
Who is who?
Even though the entire dataset comes from public sources, e-mail addresses are considered personally identifiable information so I avoid collecting them by using Github usernames instead. This is mostly fine but is a tricky proposition when data from the Git repository needs to be linked as well. Commit authors and co-authors are listed in commit metadata and the commit message using the Authored-by and Co-authored-by headers) using the traditional NAME <email@address> notation.
To link them, I used a handy user search endpoint in Github’s REST API. Again, due to rate limits, I cache the results (including misses) to avoid wasting queries on addresses I already asked for. That file I won’t be sharing though, you’ll have to recreate that from scratch if you want it. Luckily, some e-mail addresses in the repository commits are already cloaked by Github (like 55281+ambv@users.noreply.github.com), making it trivial to retrieve the Github username from that.
However, it turns out that pretty often those e-mail addresses aren’t the same as the primary e-mail address listed for a given account on Github. To circumvent that, I also imported the same information from the private PEP 13 voters database core developers hold for the purpose of electing the Steering Council each year. And finally, I used a little hack: for each unknown e-mail address, I retrieved all Github PRs with commits where it appears as an author, and assumed that the most common creator of those PRs has to be the owner of this e-mail address.
How to best explore this data?
I quickly found that writing custom Python scripts to get every piece of interesting information is somewhat tiresome. With all data in a shelf, it’s easy to put it in a Jupyter notebook and go from there. That’s what a professional data scientist would do, I guess. In fact, if you’re up for it, show me how – it might be interesting.
I myself wished for some good old SQL querying ability instead, so I converted the database to a SQLite file. I didn’t have to do much thanks to Simon Willison’s super-handy sqlite-utils library which – among other features – allows creating new SQLite tables automatically on first data insert. Wonderful! The db.sqlite file is also available for download if you’d like to analyze it yourself.
I personally spent most time analyzing it with Datasette. It allows for a lot of nice point-and-click queries with foreign key support, grouping by arbitrary data ("facets” in Datasette parlance), and exposes a raw SQL querying text box too when you need that. But it gets even better if you install plugins for it:
$ datasette install datasette-vega
$ datasette install datasette-seaborn
With those, Datasette grows the ability to visualize data you’re looking at pretty much for free. Let’s go through a few easy examples first. I run datasette with the following arguments to allow for more lengthy queries:
$ datasette \
  --setting sql_time_limit_ms 300000 \
  --setting facet_time_limit_ms 300000 \
  --setting num_sql_threads 10 \
  db.sqlite
Date ranges
Let’s start with timestamps since this will allow us to understand what timeframe we’re discussing here. First, when you launch Datasette on the SQLite export, go to the changes table and click the merged_at suggested facet, you’ll get:
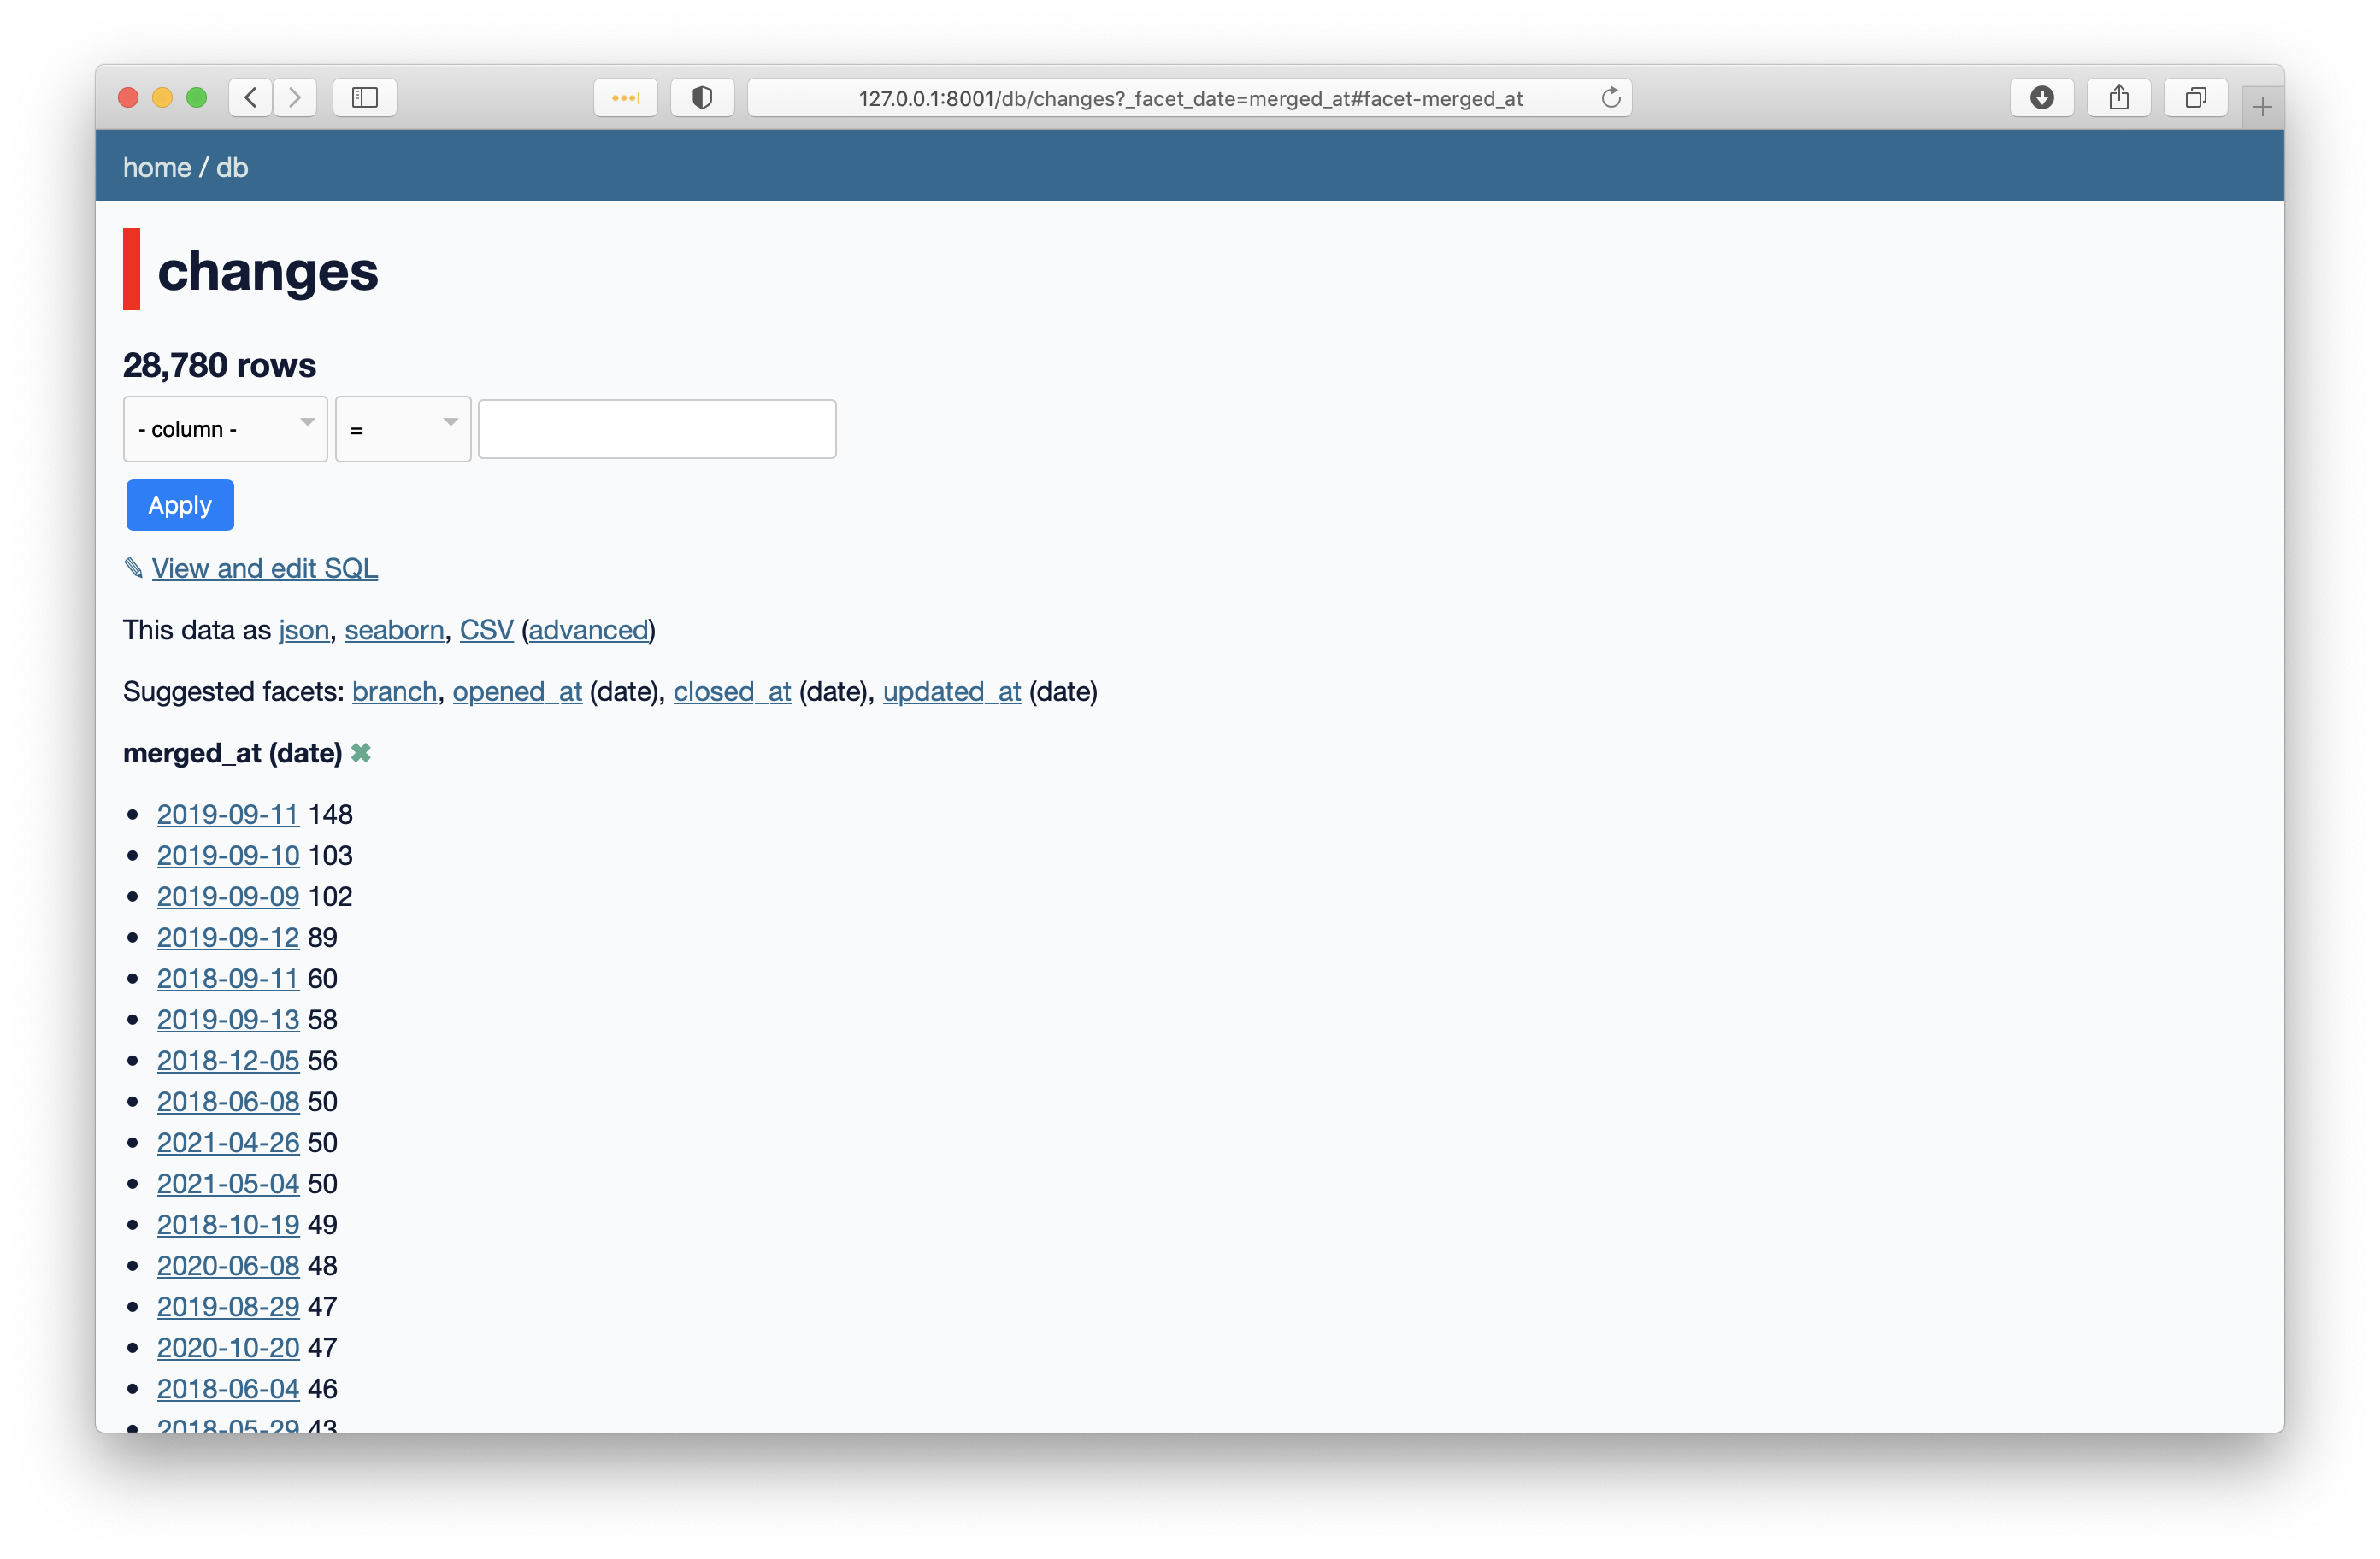
So right away you see that September 2019 was the most active recorded week in our database in terms of merges. That’s no surprise, it was the week of our annual core sprint, that year happening at Bloomberg in London. To make this look nicer, let’s modify the query a little:
select
  date(merged_at),
  count(*)
from
  changes
where
  merged_at is not null
group by
  date(merged_at)
order by
  count(*) desc
limit
  24;
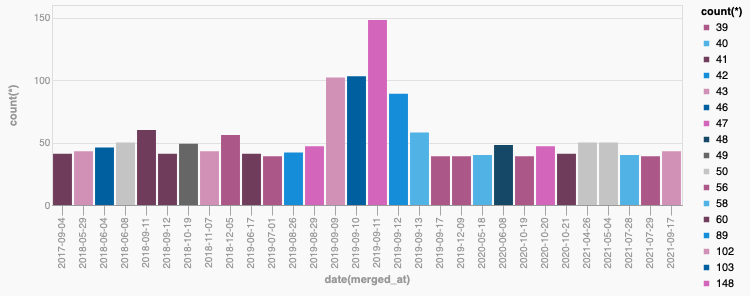
This generates the following nice graph with the Vega plugin:
We can clearly see that a core sprint generates 2X - 3X the activity as the “next best thing”. It’s tangible evidence those events are worth it. But wait, weren’t we saying that the Python 3.6 core sprint at Facebook in 2016 was the most productive week in the project’s history? Why isn’t it there.
It’s because that predates CPython’s migration to Git. Since my goal is analyzing the modern state of the project, its active committers, pull requests, and so on, using a cut off date of February 10 2017 seemed sensible. And indeed, the oldest change in the database is GH-1 from that date:
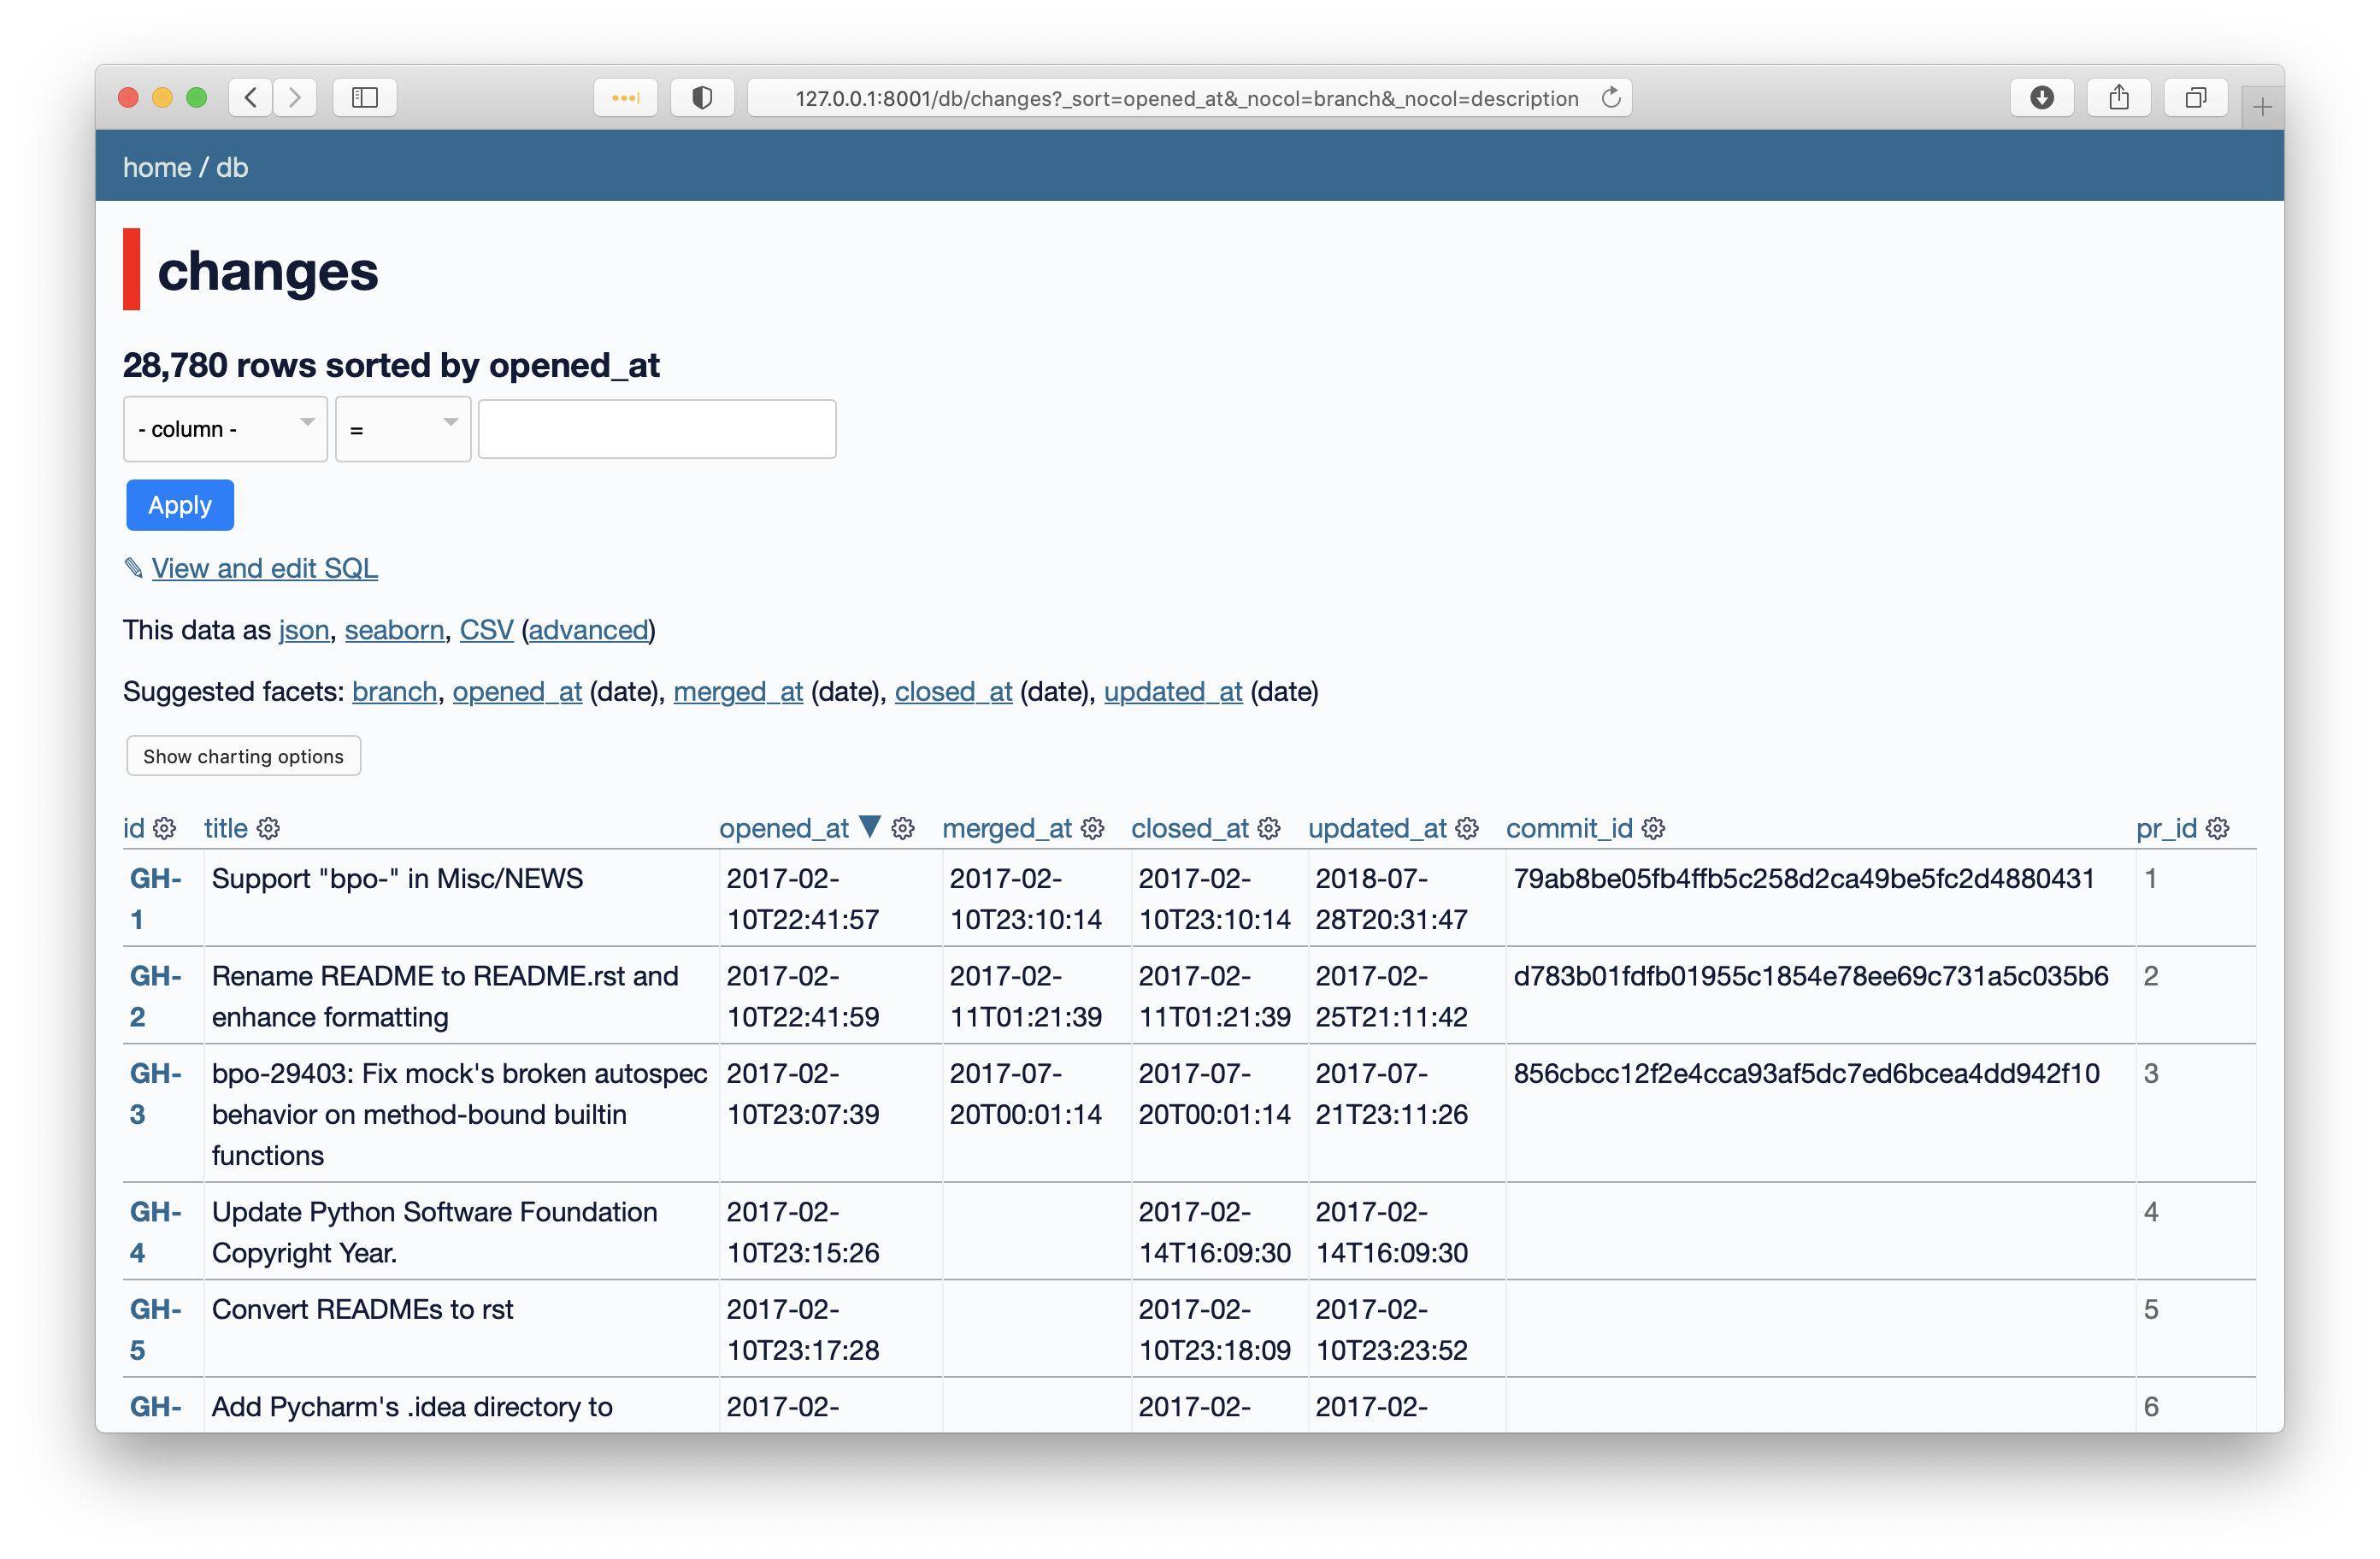
At the time of last update to this post, the database ends with GH-28825 (opened on Saturday, October 9 2021).
What are the hot parts of the codebase?
CPython is a huge software project. sloccount by David A. Wheeler counts that it currently consists of over 629,000 significant lines of Python code and over 550,000 significant lines of C code. It’s interesting to know where the developers are making most changes these days. One way is to look at the files table and go from there:
select
  name,
  count(change_id),
  sum(changes)
from
  files
  inner join changes on change_id = changes.id
where
  changes.merged_at is not null
  and changes.opened_at > date('2019-01-01')
  and changes.opened_at < date('2022-01-01')
  and name not like 'Misc/%'
  and name not like 'Doc/%'
  and name not like '%.txt'
  and name not like '%.html'
group by
  name
order by
  count(change_id) desc;
Here’s the Top 50:
| # | File name | Merged PRs | Lines changed |
| 1. | Python/ceval.c | 259 | 12972 |
| 2. | Python/pylifecycle.c | 222 | 6046 |
| 3. | Python/compile.c | 194 | 9053 |
| 4. | Objects/typeobject.c | 182 | 6484 |
| 5. | Makefile.pre.in | 177 | 1295 |
| 6. | Lib/typing.py | 166 | 4461 |
| 7. | Modules/posixmodule.c | 160 | 8014 |
| 8. | Objects/unicodeobject.c | 156 | 4907 |
| 9. | configure.ac | 154 | 1872 |
| 10. | configure | 153 | 68320 |
| 11. | Lib/test/test_typing.py | 146 | 4551 |
| 12. | Modules/_testcapimodule.c | 145 | 4576 |
| 13. | Lib/test/test_ssl.py | 143 | 4207 |
| 14. | Lib/test/support/__init__.py | 140 | 3856 |
| 15. | Python/pystate.c | 133 | 3130 |
| 16. | setup.py | 131 | 3562 |
| 17. | Modules/_ssl.c | 125 | 5745 |
| 18. | Python/sysmodule.c | 120 | 2986 |
| 19. | Grammar/python.gram | 117 | 3422 |
| 20. | Lib/test/test_exceptions.py | 109 | 2460 |
| 21. | Lib/test/test_embed.py | 109 | 3071 |
| 22. | Python/importlib_external.h | 108 | 318195 |
| 23. | .github/workflows/build.yml | 105 | 1252 |
| 24. | Modules/_sqlite/connection.c | 103 | 3034 |
| 25. | Lib/unittest/mock.py | 103 | 1729 |
| 26. | Lib/test/test_syntax.py | 102 | 2207 |
| 27. | Lib/test/_test_multiprocessing.py | 100 | 2333 |
| 28. | Python/ast.c | 97 | 8308 |
| 29. | Lib/enum.py | 96 | 5115 |
| 30. | Objects/dictobject.c | 93 | 2648 |
| 31. | Lib/test/test_enum.py | 92 | 4679 |
| 32. | Programs/_testembed.c | 91 | 4607 |
| 33. | Mac/BuildScript/build-installer.py | 89 | 1391 |
| 34. | PCbuild/pythoncore.vcxproj | 88 | 258 |
| 35. | Python/bltinmodule.c | 87 | 1055 |
| 36. | Lib/test/test_ast.py | 86 | 2412 |
| 37. | Python/initconfig.c | 84 | 3009 |
| 38. | Python/import.c | 84 | 2162 |
| 39. | Objects/object.c | 84 | 1761 |
| 40. | Modules/main.c | 83 | 4223 |
| 41. | Include/internal/pycore_pylifecycle.h | 83 | 426 |
| 42. | Parser/pegen.c | 82 | 1539 |
| 43. | Parser/parser.c | 82 | 116018 |
| 44. | PCbuild/python.props | 82 | 285 |
| 45. | Lib/test/test_os.py | 81 | 1828 |
| 46. | Python/pythonrun.c | 80 | 2487 |
| 47. | Python/importlib.h | 79 | 176191 |
| 48. | Modules/gcmodule.c | 79 | 2066 |
| 49. | Lib/idlelib/editor.py | 79 | 1677 |
| 50. | Lib/test/test_logging.py | 77 | 1204 |
This is already plenty interesting. Who would think the most change happens the deepest inside the interpreter? ceval.c, pylifecycle.c, compile.c, typeobject.c… those are some hairy parts of the codebase. You can also see from the number of changed lines that those are no small changes either.
If you follow the changes one by one, you’ll see that in many cases big changes to a given area stem from open PEPs. For instance, the grammar file along with pegen.c and parser.c are obviously related to PEP 617. If you looked at changes from 2017-2018, you wouldn’t find those files anywhere near the top. That’s why I included a date range in the query.
Who is contributing these days?
Contributing can be many things. In the context of this post, we understand it as authoring patches, commits, or pull requests, commenting on pull requests, reviewing pull requests, and merging pull requests. With the following query we can ask who contributed to the most merged changes:
select
  name,
  count(change_id)
from
  contributors
  inner join changes on change_id = changes.id
where
  changes.merged_at is not null
group by
  name
order by
  count(change_id) desc;
What’s the current top 50 entries?
| # | Github name | Number of merged PRs |
| 1. | miss-islington | 8259 |
| 2. | vstinner | 3775 |
| 3. | web-flow | 2626 |
| 4. | serhiy-storchaka | 2582 |
| 5. | pablogsal | 1249 |
| 6. | terryjreedy | 1161 |
| 7. | zooba | 959 |
| 8. | ambv | 864 |
| 9. | rhettinger | 814 |
| 10. | ned-deily | 712 |
| 11. | methane | 671 |
| 12. | Mariatta | 650 |
| 13. | benjaminp | 647 |
| 14. | ZackerySpytz | 582 |
| 15. | blurb-it[bot] | 579 |
| 16. | tiran | 489 |
| 17. | andresdelfino | 424 |
| 18. | berkerpeksag | 421 |
| 19. | gpshead | 415 |
| 20. | 1st1 | 376 |
| 21. | csabella | 362 |
| 22. | corona10 | 354 |
| 23. | JulienPalard | 313 |
| 24. | erlend-aasland | 299 |
| 25. | pitrou | 293 |
| 26. | asvetlov | 269 |
| 27. | taleinat | 254 |
| 28. | brettcannon | 247 |
| 29. | ncoghlan | 237 |
| 30. | zware | 231 |
| 31. | gvanrossum | 226 |
| 32. | iritkatriel | 217 |
| 33. | vsajip | 216 |
| 34. | matrixise | 211 |
| 35. | zhangyangyu | 204 |
| 36. | tirkarthi | 203 |
| 37. | orsenthil | 203 |
| 38. | ericvsmith | 196 |
| 39. | isidentical | 193 |
| 40. | Fidget-Spinner | 192 |
| 41. | markshannon | 188 |
| 42. | encukou | 185 |
| 43. | shihai1991 | 169 |
| 44. | jaraco | 157 |
| 45. | ethanfurman | 144 |
| 46. | lysnikolaou | 143 |
| 47. | ilevkivskyi | 137 |
| 48. | skrah | 121 |
| 49. | aeros | 121 |
| 50. | ammaraskar | 119 |
Clearly, it pays to be a bot (like miss-islington, web-flow, or blurb-it) or or a release manager since this naturally causes you to make a lot of commits. But Victor Stinner and Serhiy Storchaka are neither of these things and still generate amazing amounts of activity. Kudos! In any case, this is no competition but it was still interesting to see who makes all these recent changes.
Who contributes where?
We have a self-reported Experts Index in the Python Developer’s Guide. Many libraries and fields don’t have anyone listed though, so let’s try to find who is contributing where. Especially given the previous file-based activity, it’s interesting to see who works on what. However, the files table contains 18,184 distinct filenames. That’s too much to form decent groups for analytics.
So instead, I wrote a script to identify the top 5 contributors per file. There is a lot of deduplication there and some pruning of irrelevant results but sadly the end result is still 636 categories. Well, it’s a huge project, maybe that should be expected if we want to be detailed. I’m sure we could sensibly bring it down still but I erred on the side of providing more information rather than too little.
The full result is here. As you can see, only 18 categories don’t contain our two giants, Serhiy and Victor. So we can assume they’re looking over the entire project and remove them from the listing to see who else is there. When you do that, the list drops down to 542 categories. I won’t go through the entire set here but let’s just look at two examples. The Experts Index lists R. David Murray as the maintainer of email, let’s see what he’s up to:
$ cat experts_no_giants.txt | grep bitdancer
Lib/argparse.py: rhettinger (41), asottile (11), bitdancer (9), wimglenn (8), encukou (7)
Lib/email: maxking (90), bitdancer (44), warsaw (32), delirious-lettuce (27), ambv (22)
Lib/mailbox.py: ZackerySpytz (3), asvetlov (3), jamesfe (3), webknjaz (3), bitdancer (2), csabella (2)
Makes sense, looks like he is indeed laser-focusing on that area of Python. Let’s look at typing now:
$ cat experts_no_giants.txt | grep -E "/(typing|types.py)"
Lib/types.py: gvanrossum (17), Fidget-Spinner (17), ambv (12), pablogsal (10), ericvsmith (6)
Lib/typing.py: ilevkivskyi (135), Fidget-Spinner (100), gvanrossum (93), ambv (90), uriyyo (58)
Looks like there’s a healthy set of contributors here. Sadly, the top contributor here is Ivan Levkivskyi who is no longer active. There is a number of libraries like this, decimal being another example that comes to mind. In fact, some files are missing contributors entirely save for our two top giants. What are those files? I included them here.
Merging an average PR
What can you expect when you open your average PR? How soon will it be merged? How much review is it going to get? Obviously, the answer in a big project is “it depends”. Averages lie. But I was still curious.
select
  avg(
    julianday(changes.merged_at) - julianday(changes.opened_at)
  )
from
  changes
where
  changes.merged_at is not null;
The answer at the moment is 14.64 days. How about closing the ones we don’t end up merging?
select
  avg(
    julianday(changes.closed_at) - julianday(changes.opened_at)
  )
from
  changes
where
  changes.merged_at is null
  and changes.closed_at is not null;
Here we’re decidedly slower at over 105 days, with the longest one taking over 4 years to close.
But as I said, averages lie. Can we separate the query so that we see how long it takes to merge a PR authored by a core developer versus a PR authored by a community member? Yes, we can. The query looks like this:
select
  avg(
    julianday(changes.merged_at) - julianday(changes.opened_at)
  )
from
  changes
  inner join contributors on changes.id = change_id
where
  changes.merged_at is not null
  and contributors.is_pr_author = true
  and contributors.is_core_dev = true;
We can flip is_core_dev to false to check for non-core developer PRs. The results now show the following: it takes 9.47 days to get an average PR merged if it’s authored by a core developer, versus 19.52 if it isn’t. It’s kind of expected since review of fellow core developer work is often quicker, right? But the truth is even simpler than that. Look at this modified query:
select
  avg(
    julianday(changes.merged_at) - julianday(changes.opened_at)
  )
from
  changes
  inner join contributors on changes.id = change_id
where
  changes.merged_at is not null
  and contributors.is_pr_author = true
  and contributors.is_core_dev = true
  and contributors.did_merge_pr = true;
Yes, when a core developer is motivated to get their change merged, they push for it and in the end often merge their own change. In this case it takes a hair less than 7 days to get a PR merged. Core developer-authored PRs which aren’t merged by their authors take 20.12 days on average to merge, which is pretty close to non-core developer changes.
However, as I already said, averages lie. One thing that annoyed me here is that SQLite doesn’t provide a std dev aggregation. I reached out to Simon Willison and he showed me a Datasette plugin called datasette-statistics that added additional aggregations. Standard deviation wasn’t included so I added it. Now all you need to do is to install the plugin:
$ datasette install datasette-statistics
and you can use statistics_stdev in queries in place of builtin aggregations like avg(), count(), min(), or max().
In our particular case, the standard deviation of the last queries is as follows:
- core developer authoring and merging their own PR takes on average ~7 days (std dev ±41.96 days);
- core developer authoring a PR which was merged by somebody else takes on average 20.12 days (std dev ±77.36 days);
- community member-authored PRs get merged on average after 19.51 days (std dev ±81.74 days).
Well, if we were a company selling code review services, this standard deviation value would be an alarmingly large result. But in our situation which is almost entirely volunteer-driven, the goal of my analysis is to just observe and record data. The large standard deviation reflects the large amount of variation but isn’t necessarily something to worry about. We could do better with more funding but fundamentally our biggest priority is keeping CPython stable. Certain care with integrating changes is required. Erring on the side of caution seems like a wise thing to do.
Next steps
The one missing link here is looking at our issue tracker: bugs.python.org. I decided to leave this data source to a separate investigation since its link with the Git repository and Github PRs is weaker. It’s an interesting dataset on its own though, with close to 50,000 closed issues, and over 7,000 unclosed ones.
One good question that will be answered by looking at it is “which standard libraries require most maintenance?”. Focusing on Git and Github pull requests also necessarily skips over issues where there is no solution in sight. Measuring how often this happens and which parts of Python are most likely to have this kind of problem is where I will be looking next.
Finally, I’m sure we can dig deeper into the dataset we already have. If you have any suggestions on things I could look at, let me know.